Visualise the biomes workflow (ranking, map and biome composition)
Source:R/biomes_visualise.R
biomes_visualise.RdProduces the publication figure of the biomes workflow for a set of occurrence records. Up to three panels are drawn and combined:
Usage
biomes_visualise(
  x,
  scheme = NULL,
  definition = "all",
  biome = NULL,
  lon = "decimalLongitude",
  lat = "decimalLatitude",
  panels = c("rank", "map", "barplot"),
  top_n = NULL,
  titles = TRUE,
  legend_counts = FALSE,
  legend = TRUE,
  point_color = "#B20000",
  point_size = 0.25,
  combine = TRUE,
  verbose = FALSE
)
Arguments
- x
A data frame with longitude/latitude columns, an
sfspatial object, or aterra::SpatVectorof point geometries.- scheme
Integer in
1:31(biome scheme number). IfNULL(default), the best-fitting scheme is chosen bybiomes_rank()(withindefinition).- definition
Character. Biome definition to rank within when
schemeisNULL; passed tobiomes_rank(). Default"all".- biome
Optional single-layer
terra::SpatRaster. If supplied it is mapped directly and only themappanel is available (no ranking).- lon, lat
Column names of longitude / latitude in
x(data frame only). Defaults"decimalLongitude"/"decimalLatitude".- panels
Character vector, any subset of
c("rank", "map", "barplot")(default all three). Panels are drawn and lettered in this order.- top_n
Integer or
NULL(default). If given, only thetop_ntop-ranked schemes are shown in therankpanel;NULLshows all compared schemes.- titles
Logical. If
TRUE(default), each panel carries a left-aligned title: "Ranked biome schemes" (or "Top n ranked biome schemes" withtop_n), "Spatial projection for<reference>" and "Occurrence and species number for<reference>", where the reference is the source of the chosen scheme, e.g. "Ramankutty & Foley (1999)". WithFALSEno titles are drawn and the panel letters are placed in the top-left corners instead.- legend_counts
Logical. If
TRUE, append the number of records per biome to the map legend labels. DefaultFALSE(biome names only).- legend
Logical. If
TRUE(default), draw the biome colour legend on the map panel.- point_color
Colour of the occurrence points. Default
"#B20000".- point_size
Numeric size of the occurrence points. Default
0.25.- combine
Logical. When more than one panel is drawn:
TRUE(default) combines them into one lettered figure (a, b, c);FALSEreturns a named list of the individual panels (no letters). Ignored for a single panel (always returned as a bare plot).- verbose
Logical. Passed to
biomes_rank(). DefaultFALSE.
Value
For a single panel, a ggplot object (map) or a cowplot
object (rank, barplot). For several panels: a combined cowplot
object when combine = TRUE (default), or a named list of the
individual panels (rank, map, barplot) when combine = FALSE.
Print to display or save with ggplot2::ggsave().
Details
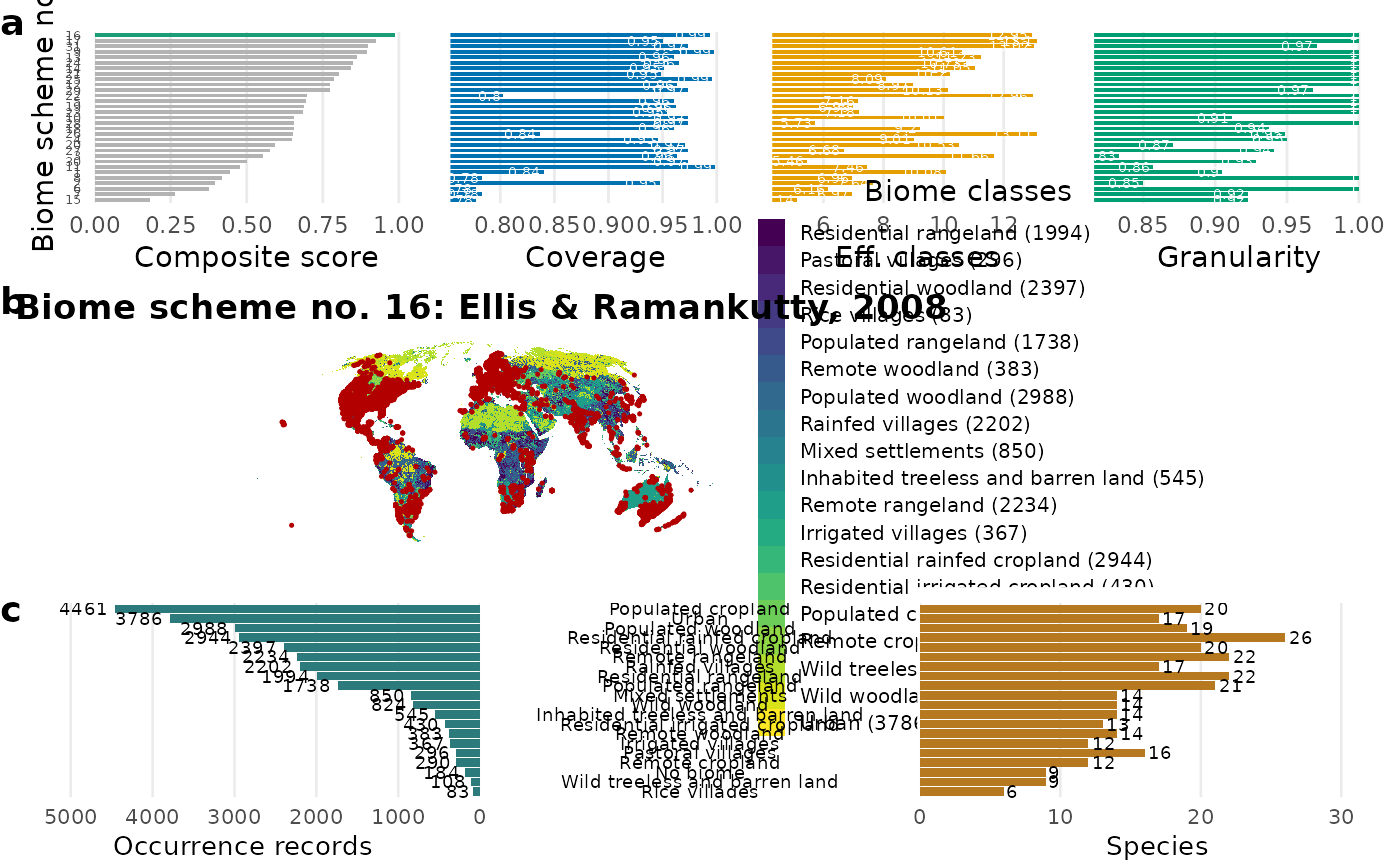
rank: the data-driven ranking of the biome schemes (
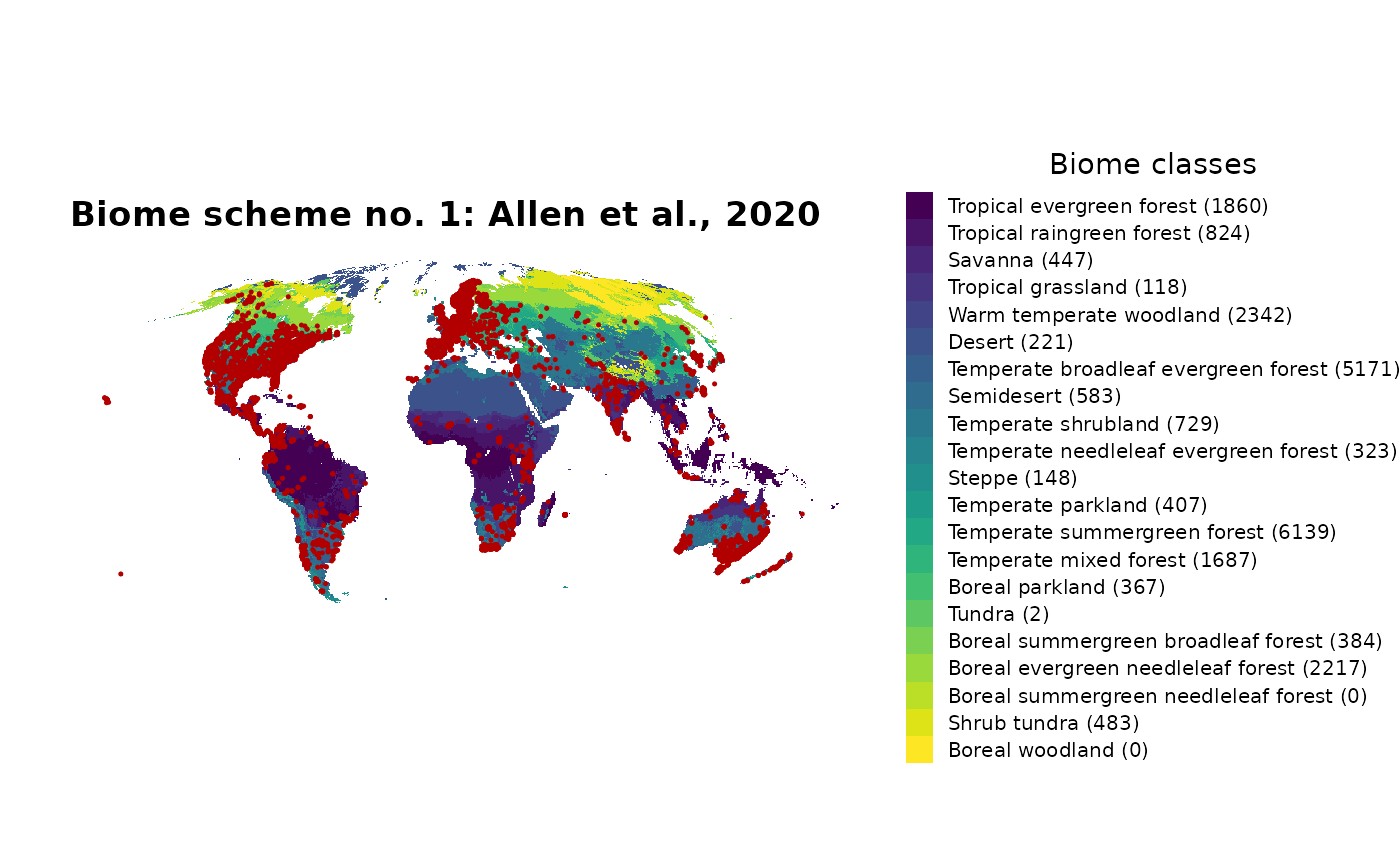
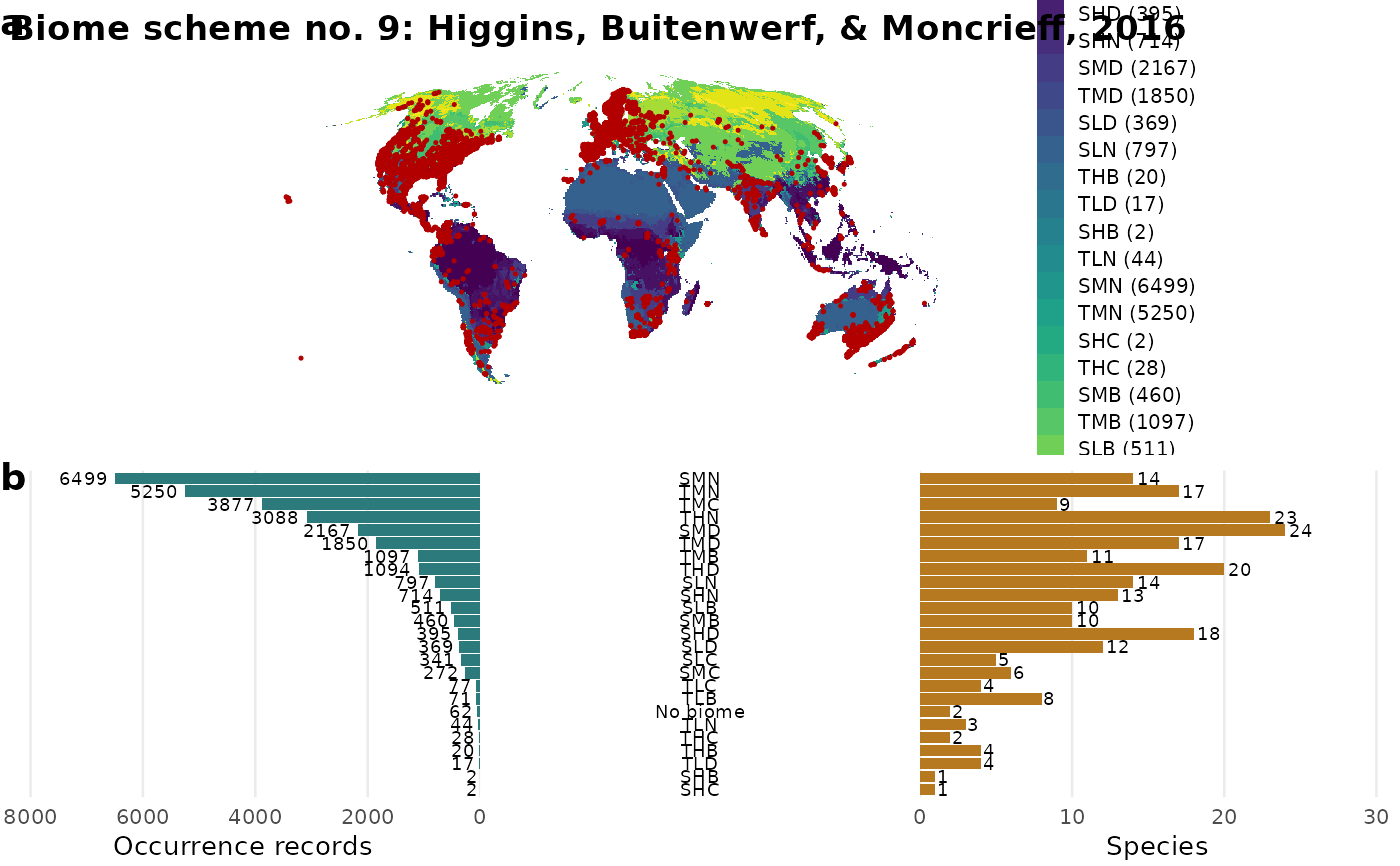
biomes_rank()): the composite score per scheme next to the criterion values it averages (coverage, effective number of biomes, granularity), all on the common 0 to 1 scale that enters the composite (the min-max rescaled values). Schemes are labelled by their biome scheme number and source, e.g.25 (Ramankutty & Foley, 1999); the composite bar of the best scheme and, in each criterion panel, the bar with the best value of that criterion are outlined in red. All compared schemes are shown unlesstop_ncuts the list.map: the occurrence records (points) mapped over the chosen biome scheme, with the number of records per biome optionally appended to the legend labels.
barplot: the number of occurrence records (left) and species (right) per biome, with the biome names in the centre. Bars use the same colour per biome as the map; off-map records ("no biome") are grey.
Which panels are drawn is controlled by panels. When several panels
are combined into one figure, the panel letters (a, b, c) are assigned
in drawing order and written into the panel titles ("a: ..."), so
selecting only rank and barplot labels them (a) and (b).
Examples
# \donttest{
data("bombacoideae_occurrences")
# full figure (rank + map + barplot), best scheme chosen automatically
biomes_visualise(bombacoideae_occurrences)
#> <SpatRaster> resampled to 5e+05 cells.
 # only the map, for a fixed scheme
biomes_visualise(bombacoideae_occurrences, scheme = 1, panels = "map")
#> <SpatRaster> resampled to 5e+05 cells.
# only the map, for a fixed scheme
biomes_visualise(bombacoideae_occurrences, scheme = 1, panels = "map")
#> <SpatRaster> resampled to 5e+05 cells.
 # map + barplot for the best vegetation scheme
biomes_visualise(bombacoideae_occurrences, definition = "vegetation",
panels = c("map", "barplot"))
#> <SpatRaster> resampled to 5e+05 cells.
# map + barplot for the best vegetation scheme
biomes_visualise(bombacoideae_occurrences, definition = "vegetation",
panels = c("map", "barplot"))
#> <SpatRaster> resampled to 5e+05 cells.
 # }
# }